레이블이 jmeter인 게시물을 표시합니다. 모든 게시물 표시

2015년 8월 3일 월요일

JMeter Non-GUI mode / JMeter 터미널or커맨드창 으로 실행하기

JMeter Non-GUI mode  / JMeter 터미널or커맨드창 으로 실행하기


GUI환경이 편한것은 당연하지만, GUI가 지원되지 않는 환경도 있습니다.
특히나 클라우드 서비스를 사용하는데 있어서 TUI(Text User Interface)를 쓸수밖에 없는 상황이 있습니다.
기기
저의 경우는 JMeter를 Non-GUI로 실행 하였습니다.


Like always for the English-speaking developers with the help of Google Translator provides English.

It is easy GUI environment for granted, but there is also a GUI environment is not supported. 
Especially in using the cloud services for TUI (Text User Interface) can not only write these circumstances.
--------------------------------------------------------------
터미널(윈도우의 경우 커맨드창)jmeter -n 을 입력할경우 아래와 같은 옵션을 볼수 있습니다.

Terminal (for Windows command window), if you enter, you see the following options: jmeter -n.

--------------------------------------------------------------
Non-GUI runs require a test plan
Incorrect Usage
        -h, --help
                print usage information and exit
        -v, --version
                print the version information and exit
        -p, --propfile <argument>
                the jmeter property file to use
        -q, --addprop <argument>
                additional JMeter property file(s)
        -t, --testfile <argument>
                the jmeter test(.jmx) file to run
        -l, --logfile <argument>
                the file to log samples to
        -j, --jmeterlogfile <argument>
                jmeter run log file (jmeter.log)
        -n, --nongui
                run JMeter in nongui mode
        -s, --server
                run the JMeter server
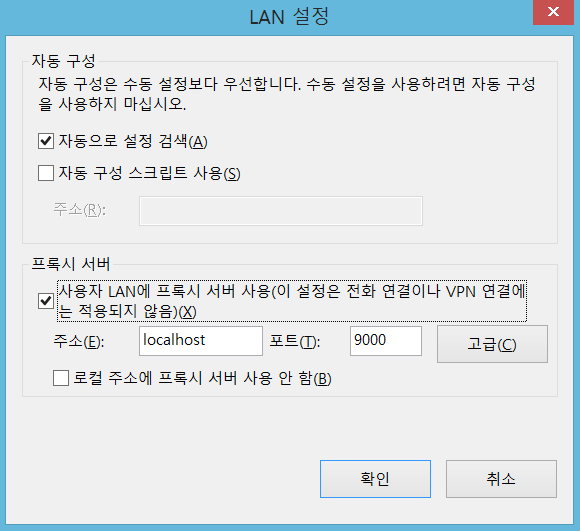
        -H, --proxyHost <argument>
                Set a proxy server for JMeter to use
        -P, --proxyPort <argument>
                Set proxy server port for JMeter to use
        -N, --nonProxyHosts <argument>
                Set nonproxy host list (e.g. *.apache.org|localhost)
        -u, --username <argument>
                Set username for proxy server that JMeter is to use
        -a, --password <argument>
                Set password for proxy server that JMeter is to use
        -J, --jmeterproperty <argument>=<value>
                Define additional JMeter properties
        -G, --globalproperty <argument>=<value>
                Define Global properties (sent to servers)
                e.g. -Gport=123
                 or -Gglobal.properties
        -D, --systemproperty <argument>=<value>
                Define additional system properties
        -S, --systemPropertyFile <argument>
                additional system property file(s)
        -L, --loglevel <argument>=<value>
                [category=]level e.g. jorphan=INFO or jmeter.util=DEBUG
        -r, --runremote
                Start remote servers (as defined in remote_hosts)
        -R, --remotestart <argument>
                Start these remote servers (overrides remote_hosts)
        -d, --homedir <argument>
                the jmeter home directory to use
        -X, --remoteexit
                Exit the remote servers at end of test (non-GUI)

--------------------------------------------------------------

가장 쉬운 방법은 아래와 같습니다.
The easiest way is as follows.


jmeter -n -t {TestFileName}.jmx -l {LogFileName}.jtl


Example


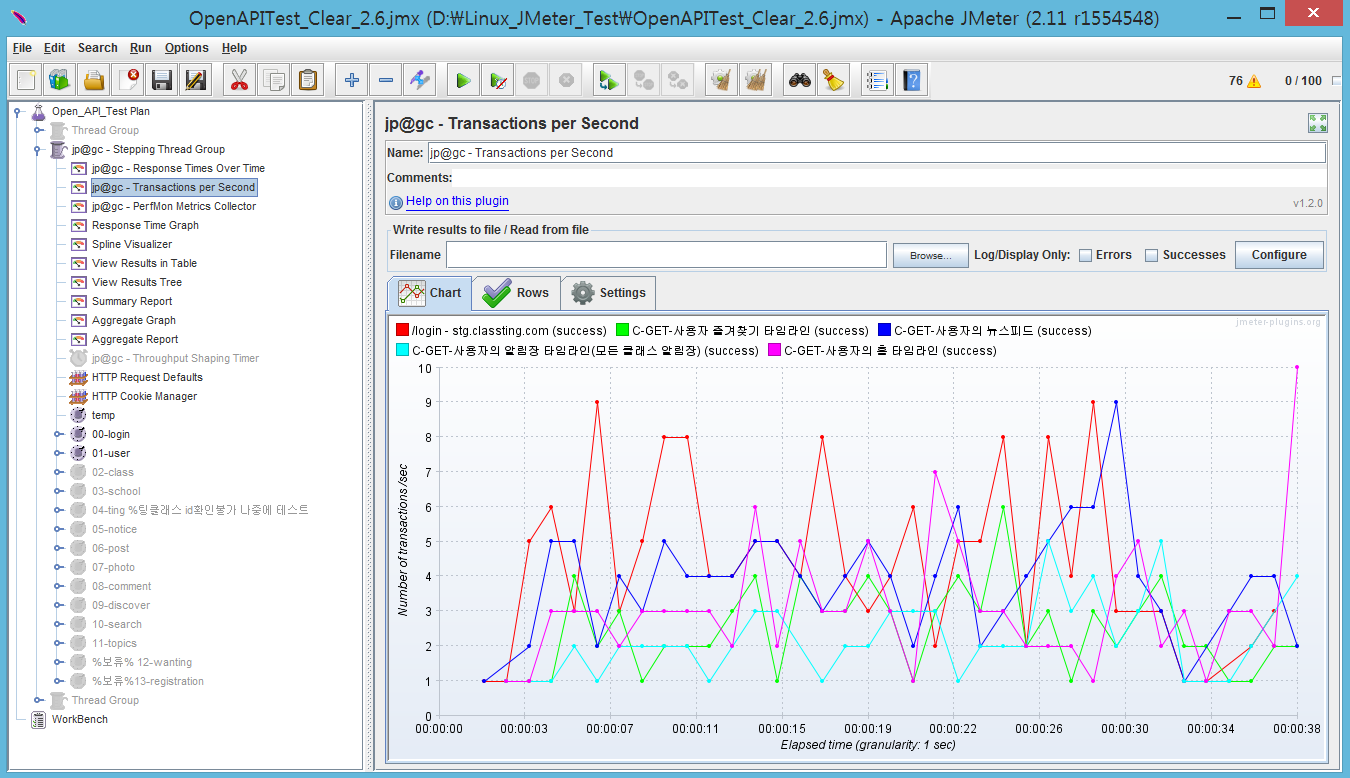
테스트를 실시한 이후 로그파일을 로딩하여 다양하게 결과를 확인할 수 있습니다.

You can check the results after the test conducted by loading the log files in various ways.


우선 JMeter를 켜고 평소에 즐겨 사용하던 리스너를 열고 Browse 버튼을 누르면 결과를 볼수 있습니다. 대부분의 리스너로 로그 기록을 확인할 수 있지만 제가 직접 경험한 바에 의하면 안타깝게도 jp@gc - Response Times Over Time은 로그파일 로딩을 지원하지 않습니다.
만약 당신이 해결책을 알고 있다면 지식을 공유해 주길 바랍니다.

First, turn on the JMeter open a listener favorite was the usual press the Browse button, you can see the results. Most of the listeners can check logs by direct experience, but unfortunately I did reportedly 'jp @ gc - Response Times Over Time' does not support the log file is loaded. 
If we want you to share your knowledge if you know the solution.


PS.테스트 결과는 보안과 밀접하여 게시하지 않았습니다.
그러나 이 글을 읽고 계신 분이라면 보여드리지 않아도 알거라고 생각합니다.

PS.Test results are not posted in close and secure. 
But I think you already know, if you do not show the minutes to read this article.


2015년 7월 25일 토요일

Use the JMeter with Plug-in [CSV Data Set Config] / JMeter와 Plug-in 사용 [CSV Data Set Config]

Use the JMeter with Plug-in [CSV Data Set Config] / 
JMeter와 Plug-in 사용 [CSV Data Set Config]


CSV Data Set Config는 사전에 준비된 다수의 계정을 로그인해야하는 상황, 검색 API를 호출하는 상황, 일련의 Data Set을 순차적으로 사용해야하는 상황등 에서 유용하게 사용됩니다.
CSV Data Set Config situation must log in to multiple accounts prepared in advance, calling the situation a search API, a series of sequential Data Set is useful in such situations you should use.


CSV Data Set Config를 추가하는 방법은 아래와 같습니다.
How to add the CSV Data Set Config is as follows

step - 1


사전에 준비된 테이터를 실행할 jmx파일(jmeter test file)과 같은 경로에 놓아둡니다.
파일 이름은 test_data 이며 예제 데이터는 아래와 같습니다.
Leave the path, such as the jmx ready to run the mutator dictionary file (jmeter test file).
The file name is test_data sample data is as follows.

apple,
banana,
pineapple,
melon,
strawberry

step - 2


CSV Data Set Config로 돌아와서
Filename 칸에 test_data 를 입력
Variable Names에 fruits라고 입력합니다.
Return to the CSV Data Set Config
Enter the test_data the Filename column
Enter the fruits called Variable Names.

이때 기본 구분자는 ' , ' 이며 Delimiter에서 변경 하실수 있습니다.
The default delimiter is ',' and can change from Delimiter.

step - 3


Thread Group에 HTTP Request를 하나 추가한후
이름에 ${fruits} 를 추가합니다
${} 는 jmeter에서 사용하는 expression language로써
방금 Variable Names에 입력했던 fruits를 사용할수 있게 해줍니다.

Add, and then one HTTP Request to the Thread Group
Add the $ {fruits} in the name
$ {} As an expression language that is used in jmeter
Just it allows you to use the fruits were entered in the Variable Names.

step - 4


테스트 진행을 해보면 어떠한 server ip도 적지 않았기 때문에 모두 빨간색으로 오류 표시가 됩니다.
그러나 주목할점은 우리가 미리 입력해논 test_data가 정상적으로 parsing이 되었냐 하는것입니다.
If the test goes all die because no server ip is an error displayed in red.
Notably, however, is that we have played pre test_data detractors would normally have been parsing.

step - 5


사진과 같이 순차적으로 parsing이 되어 사용됩니다.
그러나 처음 설명한것과 같이 다수의 계정을 로그인을 해야하는 상황 같은경우 id pw가 필요합니다.
즉 data set이 2개가 1쌍으로써 움직여야 한다는것이지요,
이 예제를 위해 방금 입력한 test_data를 아래와 같이 변경합니다.

The parsing sequence is used as shown in the picture.
However, if such a situation must log in to multiple accounts, as first described requires the id pw.
That data set is that the two must be one pairs.
For this example, just type the changes below test_data.

apple,1$,
banana,2$,
pineapple,3$,
melon,5$,
strawberry,6$

step - 6


또한 CSV Data Set Config 에서 Variable Name도 추가해줍니다.
이때 주의할점은 띄어쓰기를 하면 안됩니다.
It also allows add Variable Name from the CSV Data Set Config.
It should be noted that this case should not be a space.

stop - 7


마찬가지로 price를 확인하기 위해 HTTP Request에도 ${price}를 추가해줍니다.
Similarly, HTTP Request to confirm the price makes adding $ {price}.

step - 8


결과는 아래와 같습니다
Results are as follows:

stop - 9


이 글은 여기까지 입니다.
공식 Documentation 링크 첨부합니다.
This article is here.
Attach Official Documentation link.

http://jmeter.apache.org/usermanual/component_reference.html#CSV_Data_Set_Config


Use the JMeter with Plug-in [Part-2 Advance] / JMeter와 Plug-in 사용 [Part-2 Advance]

Use the JMeter with Plug-in [Part-2 Advance] 

/ JMeter와 Plug-in 사용 [Part-2 Advance]

Waring : With the help of Google translator for English speaking developers offer. Please give consideration to non-smooth representation.
English is blue.

기존 Thread Group을 disable로 바꾸고 새로운 Thread Group을 만든뒤
아래와 같은 사항을 추가했습니다.
After you create a new Threadgroup replace the existing Threadgroup to disable 
I like to add the following points.


Test Plan -> Add -> Listener -> jp@gc Response Times Over Time
Thread Group -> Add ->  Logic Controller -> Simple Controller
Simple Controller -> Add -> Sampler -> HTTP request


HTTP Request를 사용할때 주의할 사항은 JMeter 자체적으로 'http'를 추가하기 때문에
Server Name or IP 에 http를 적으면 중복으로 인해 오류가 된다는 것입니다.
Things to note when using the HTTP Request in JMeter since adding the 'http' itself 
If ever the http Server Name or the IP is that the error due to redundancy.


Thread Group에서 부하테스트를 설정합니다.
1번은 동시 접속자 수 이며
2번은 1명당 반복 횟수 입니다.

현재 10thread * loop 5이므로 50명이 요구하는거랑 비슷하다고 할수 있습니다.
(전적으로 이해를 돕기위한 단순 계산이므로 양해 해주시길 바랍니다.)

Sets the load(stress) test on the Thread Group. 
1 concurrent users and 
2 times per a number of iterations. 

Because now you can 10thread * loop 5 that 50 people had had similar requirements. 
(Please note that because it is a simple calculation to help understanding totally understand.)


테스트를 진행한후 jp@gc -Respons Times Over Time을 클릭하면 아래와 같은 차트를 볼수 있습니다.
The test was conducted after clicking the jp @ gc -Respons Times Over Time you can see the following chart.


부하테스트 라고 하기엔 부적절할 정도로 50번의 리퀘스트가 2초만에 끝났습니다.
그러나 부하테스트를 보여주기 위해 위에 나열된 3개의 사이트에 마구잡이로 ping을 보낼수도 없으니 타 사이트는 이정도로 마무리 하도록 하고 실제 제가 애용하는 테스트를 보여드리도록 하겠습니다.
Request is over 50 times in 2 seconds, so that the load test be inappropriate. 
But up to picture also send a ping at random to three sites listed above to demonstrate the load test, short of the other sites, and to finish the test, I'll show you my favorite real.


그리고 당신이 방금 사용한 jp@gc Respons Times Over Time은 Plug-in이에요.
jp@gc가 들어간 모든것은 플러그인 이라고 생각하시면 되요.
Jp @ gc Respons Times Over Time and you're just using Plug-in. 
jp @ gc is into everything you think you are Can I plug-ins.


 Plug-in Controller인 jp@gc Stepping Thread Gruop입니다.
내용이 잘 나와있어서 설명은 생략 하도록 하겠습니다.
The Plug-in Controller is jp @ gc Stepping Thread Gruop. 
Information listed in this description will be well to omit.


응답시간 측정입니다.
The response time measurement.


Transaction Per Second 측정입니다.
초당 몇개의 Transaction을 처리 할 수 있는지 측정하는 겁니다.
The Transaction Per Second measured. 
Measures that will be able to handle some of the Transaction second.


에러율 체크입니다.
The error rate check.


ps.
ppt작업을 위해 윈도우 환경에서 진행하였지만 실제로 테스트를 진행할때는 linux를 이용합니다. 여러분 또한 jmeter를 제대로 활용 하려면 linux를 사용하는게 났습니다.

ps.
ppt work for progress in the Windows environment but actually using linux conduct a test. You also want to take advantage of the jmeter properly noticed use linux.


일정으로 인해 여기까지만 작성하고 시간이 허락한다면 Part-3 Ultimate 를 작성하여 원격접속및 클러스터링도 올리도록 하겠습니다.
또만나요 :D

We will, if only because of the schedule here and the time allowed to create a Part-3 Ultimate to raise even a remote connection and clustering. 
See you again: D


Use the JMeter with Plug-in [Part-1 Basic] / JMeter와 Plug-in 사용 [Part-1 Basic]

Use the JMeter with Plug-in [Part-1 Basic] 

/ JMeter와 Plug-in 사용 [Part-1 Basic]

Waring : With the help of Google translator for English speaking developers offer. Please give consideration to non-smooth representation.
English is blue.


JMeter는 apache에서 진행하는 프로젝트중 하나로 공식 홈페이지는 아래와 같습니다.
JMeter is one of the projects to proceed on apache websites are listed below.

http://jmeter.apache.org/


이 글에서 사용하는 JMeter는 2.11 버전으로써 Java 6 이상의 버전이 설치 되어 있어야 합니다. 다운로드 받은 파일을 압축을 풀면 {JMeter_Home}/bin 안에 실행 파일이 있으며
리눅스의 경우 jmeter.sh / 윈도우의 경우 jmeter.bat 을 실행하시면 됩니다.
JMeter is used in this article, you must have the Java 6 or later version by version 2.11. After unzipping the downloaded file {JMeter_Home} / bin is executable and in For the case of Linux jmeter.sh / window, execute the jmeter.bat.


*{JMeter_Home}은 당신이 압축을 푼 경로를 의미합니다.
*{JMeter_Home} denotes the path you extracted.


JMeter 자체도 훌륭하지만, java진영의 매력은 3rd party lib가 아닐까요?
아래 사이트에서  JMeterPlugins-Standard-1.2.0.zip,  을 다운로드 받습니다.
JMeter itself is great, but I think the charm of the java area 3rd party lib?
Under the site   JMeterPlugins-Standard-1.2.0.zip,   the subject downloads.

http://jmeter-plugins.org/downloads/all/

다운로드 받은 파일의 압축 해제후 안에 있는 jar 파일들을 {JMeter_Home}/lib/ext 안에 복사한후 JMeter를 재시작합니다.
Copy the jar file in the downloaded file after decompression in {JMeter_Home} / lib / ext and then restart the JMeter.

첫 화면은 다음과 같습니다.
The first screen is as follows.

그림 1-1


JMeter를 활용하는 방법은 크게 2가지가 있습니다.
1.Recoding 기능을 활용하여 사용자의 모션을 그대로 재현 하는 방법.
2.스크립트(테스트 내용)을 작성하여 테스트 하는 방법.

물론 두가지 다 궁극적인 목표는 부하 테스트 일것입니다.

쉬운 예제를 통해 이해하기 쉽도록 Simple한 Recoding용 Test Plan을 만들어 보도록 하겠습니다.

How to take advantage of JMeter are largely two ways.
1.Recoding reproduce the user's motion. 
2. How to write test scripts (test details). 

Of course, the ultimate goal is two kinds of load(stress) testing ilgeot. 

Through an easy-to-understand examples to make it easier, let's make one Simple Test Plan for Recoding.

그림 1-2

Test Plan 우측 마우스를 클릭하면 Add 가 나오고
다양한 기능들을 작성할수 있습니다.

가장 기본적인 Thread인 Thread Group을 추가하고
Thread Group 하위에 Logic Controller -> Recoding Controller 를 추가합니다.

이후 아래 두가지를 더 추가해줍니다.
 Test Plan -> Add -> Listener -> View Result Tree
 Test Plan -> Add -> Config Element -> Http Cookie Manager

완성된 화면은 아래와 같습니다.

Clicking the Test Plan Add a right-out 
You can create a variety of functions. 

Add a Thread Group, and the most fundamental Thread 
Thread Group subordinate to Logic Controller -> Add the Recoding Controller. 

Lets add more later down the two. 
  Test Plan -> Add -> Listener -> View Result Tree 
  Test Plan -> Add -> Config Element -> Http Cookie Manager 

The completed screen is shown below.

그림 1-3


모두 추가하셨으면
WorkBench -> add-> Non-Test Elements -> HTTP(s) Test Script Recoder 를 추가합니다.

When you've added all 
WorkBench -> add-> Non-Test Elements -> HTTP (s) to add the Test Script Recoder.
그림 1-4


HTTP(S) Test Script Recoder의 Port를 자신이 원하는 것으로 설정합니다.
저는 9000으로 하겠습니다.

HTTP (S) Port sets as they want in the Test Script Recoder. 
I'm going into 9000.

그림 1-5


Recoding의 원리는 Proxy서버를 이용하는 것 입니다.
Start버튼을 누르기전에 브라우저의 Proxy설정을 해주어야 합니다.


Proxy setting - Windows OS


Windows 운영체제를 사용하는 경우 Chrome 브라우저와 Internet Explorer를 사용하는게 간편합니다.


Recoding is the principle of using a Proxy server. 
The haejueoya your browser's Proxy settings before pressing the Start button. 

If you are using a Windows operating system using easy haneunge Chrome browser and Internet Explorer.


그림 1-6
Chrome 의 경우
-설정 -> 프록시 설정 변경
Internet Explorer 의 경우
-설정 -> 인터넷 옵션

For Chrome 
- Settings -> Change proxy settings 
For Internet Explorer 
- Settings -> Internet Options


그림 1-7

LAN 설정 클릭.

Click LAN Settings.

그림 1-8


프록시 서버 체크 후 JMeter에 입력한 포트 입력(저는 9000 포트를 사용합니다.)
Enter the proxy server port, then enter check-in JMeter (i user 9000 port)


Proxy setting - Linux OS


Linux OS를 사용하는경우 Firefox브라우저를 이용하거나 /ext/profile을 수정하거나
커맨드창으로 통해서 임시적인 proxy설정을 할 수 있습니다.


1.User the Firefox


-----------------------------------------------------------------------------------------------------------   

2.Use the Command Line


set proxy

unset proxy
export http_proxy=http://127.0.0.1:port
export https_proxy=http://127.0.0.1:port

unset http_proxy
unset https_proxy
-----------------------------------------------------------------------------------------------------------

----------------------------------------------------------------------------------------------------------- 

3.setting Profile

$sudo vi /etc/profile


-----------------------------------------------------------------------------------------------------------


설정을 완료한 후에 start를 누르고 아무 사이트나 방문해 보시면
주고 받은 모든 데이터가 Recoding 컨트롤러에 저장 되어있음을 알수 있습니다.
After completing the settings, press the start you see or visit any site 
You know who to give all the data that is stored in the Recoding controller.

그림 1-9

Recoding Controller 하위에 제가 했던 action을 포함한 브라우저로 주고받은 모든 데이터가 기록되어 있으며 우측에 Parameter까지 상세하고 나오는것을 알수 있습니다.
All data sent and received by the sub-Recoding Controller browsers, including an action I did, and you know that the details are recorded and shown on the right side to Parameter.


그림 1-10

1번 버튼을 누를경우 Recoding Controller에 있는 Action들을 실행합니다.
2번 버튼을 누를경우 테스트 결과를 삭제합니다.

테스트 결과는 처음에 추가했던 View Results Tree에서 볼수 있습니다.


If you press the 1 button to execute the Action in the Recoding Controller. 
If you press the button twice to delete the test results. 

Test results can be viewed in the View Results Tree was added to the first.


그림 1-11

단순한 테스트 결과에 실망하지 마세요.
당신이 JMeter에 친숙하게 다가가기 위해 Non-Graphical 한가장 간단한 예제를 작성한 것 뿐입니다.
Do not be disappointed with the results of a simple test. 
Only you will create a Non-Graphical most familiar simple example to go off at JMeter.


다음장에서 Plug-in을 활용한 테스트를 보도록 하겠습니다.
Let the test using the Plug-in in the next chapter.

ps.저장 버튼을 누르면 '.jmx' 확장자 파일로 Test Plan이 저장됩니다.
잊지마세요. 자주 저장하고, 자주 백업해 놓으세요.
ps. If you press the Save button to save this Test Plan to '.jmx' file extension. 
Do not forget. Save often, and frequently, place it back.